
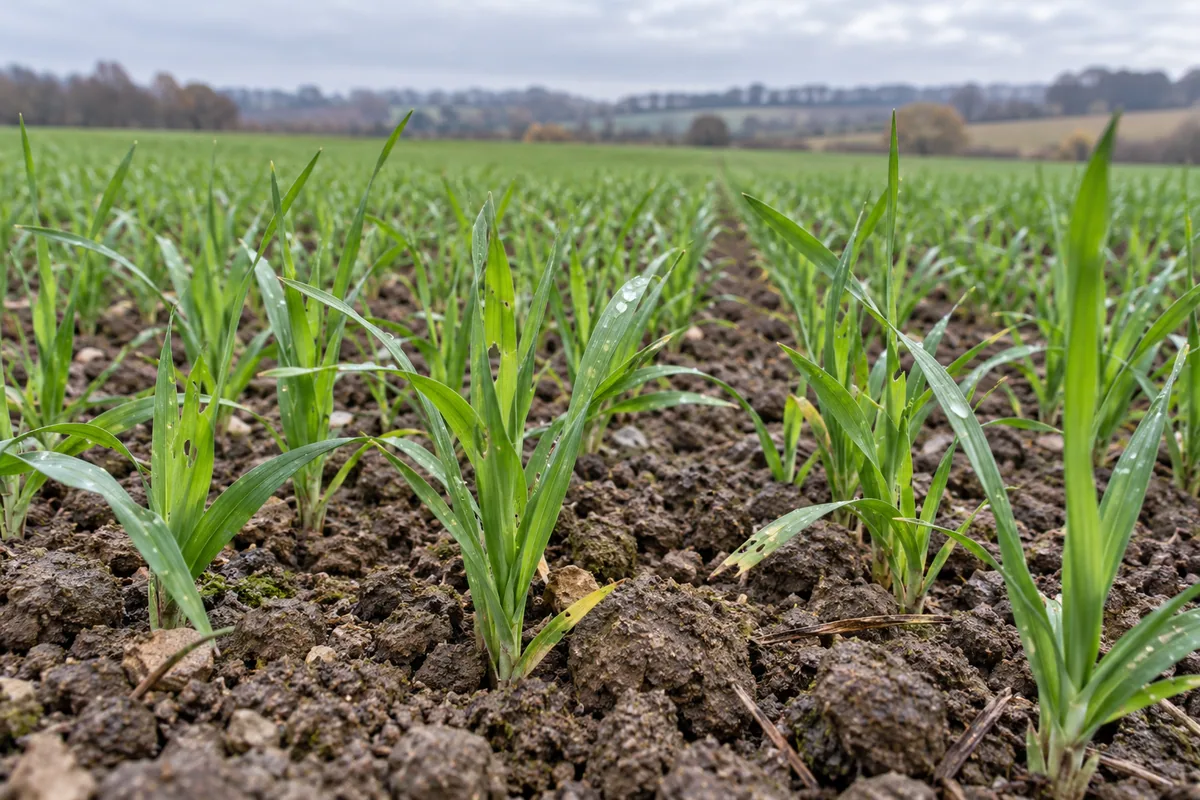
Wheat pest monitoring: protecting early tiller growth
An article by the Agrico-M team. Agronomic information is general; technical sources are identified in the article where cited. Contact our team to suggest a correction. Contact
In autumn-sown wheat in Covasna and Harghita, distinguish slug feeding from aphid presence before choosing an intervention. Use repeatable trapping and crop walks, then interpret results with crop stage and weather. The AHDB reference points below and the downloadable field sheet keep feeding injury separate from virus-vector risk during establishment.
Which practical reference points can you use?
Match the method to the problem: refuge traps for slug activity, plant inspection for aphids and temperature records for their development. The table gives British monitoring references. Combine them with fresh damage and crop vulnerability locally. Record inspection conditions so that a low catch on dry soil is not mistaken for evidence of low risk.
| Check and decision | Source / basis |
|---|---|
| Set traps on visibly moist soil at 5–25°C; return under suitable conditions if the surface is dry. | AHDB — Slug monitoring |
| Use an approximately 25 cm cover and non-toxic bait; inspect early after overnight exposure. | AHDB — Slug monitoring |
| AHDB layout: 9 traps in a W, or 13 above 20 ha; keep extra hotspot traps separate. | AHDB — Slug monitoring |
| Four slugs/trap is a British winter-cereal risk reference from sowing to GS21; verify fresh damage and local context. | AHDB — Slug monitoring |
| For the AHDB temperature model, accumulate daily mean temperature above a 3°C base from emergence. | AHDB — BYDV tools |
| At 150°C-days intensify monitoring; 170°C-days signals a possible second generation, not a local spray instruction. | AHDB — BYDV tools |
| If aphids are present, record colonised plants and wheat stage before interpreting the temperature map. | AHDB — BYDV tools |
| If fresh injury is patchy, photograph and count those zones separately; a route average can conceal local damage. | AHDB — Slug monitoring |
What are we protecting during tillering?
Two fields sown during the same week may need different interpretations because emergence, soil or exposure differs. Ask whether plants are continuing to produce healthy tissue and whether the affected area is stable. A single photograph taken from the road cannot answer those questions.
Walk into the crop where access allows, then compare an affected patch with a nearby area that appears to be developing normally.
How should you choose a repeatable route?
Before entering the field, check the sowing date, previous crop and earlier observations. Include the interior, field edges and places with a history of problems. Return to reference points on later visits, but add new points so that inspection does not become limited to convenient locations.
Respect access conditions and avoid damaging soil that is too wet. Record any part you could not inspect instead of treating it as healthy by default.
At each point, look at the general pattern before examining individual leaves and plant bases. Take a wider photograph, a whole-plant image and a close view of the symptom. Add a simple size reference where helpful. Note whether you selected the spot specifically because it looked poor. Such a sample is useful for diagnosis, but it is not a representative estimate of damage across the entire field.
What links the pest to the observed damage?
An organism found on a leaf does not automatically explain every surrounding symptom. Look for the feeding sign, the damaged plant and, where possible, the responsible organism together. Examine neighbouring leaves and apparently healthy plants too.
If identification is uncertain, keep clear photographs and seek agronomic confirmation. Do not turn a tentative name into a confirmed identification simply because a record form has a box that needs filling.
Slugs are one documented establishment risk in wheat. The cited AHDB research report comes from a 2001–2005 project and is historical evidence, useful here for the importance of observing crops under conditions favourable to activity. Its older chemical advice is not presented as current instructions. Record traces, consumed tissue and soil conditions. Failing to see a slug during one visit does not, by itself, resolve the diagnosis. AHDB — Slug monitoring
How do you track aphids and virus risk?
Do not look only for chewed leaves. AHDB explains that aphids can transmit barley yellow dwarf virus, BYDV, including to wheat; this differs from tissue consumed by slugs. Record observed aphids separately from chewing signs and seek identification. Finding an aphid does not itself establish plant infection. British alerts and models are not local warnings for Romania; assess the field context with your agronomist.
What else could explain the symptoms?
Where appropriate, carefully lift a few plants from the boundary between better and poorer growth. Examine roots, the plant base and the surrounding soil layer. Look for seeds or seedlings in empty sections of the row.
Establish whether plants emerged and subsequently disappeared, or whether the problem began before emergence. Those are different histories requiring different evidence, even when the crop looks similar from a distance.
What should the field sheet contain?
A useful field sheet should make sense to a colleague who did not attend the inspection. Keep the same field order and units. Do not combine plant counts, tiller counts and damaged-leaf counts: each describes something different.
When you count a sample, record its area or number of examined plants and explain how you selected it. An unexplained percentage is difficult to compare with another visit, even if it looks precise.
- Date, field identity, known variety and the growth stage actually observed.
- Inspection-point location, type of area and photographs belonging to that observation.
- Visible signs, confirmed or uncertain identification and conditions during the visit.
- Changes since the previous check and information still needed before a decision.
- Who will confirm the diagnosis, the next inspection and the reason for any proposed action.
What should you check after inspection?
After any measure, revisit the same points and describe the result: healthy new leaves, stable symptoms, missing plants or an expanding patch. Lack of an immediate change is not automatic proof of failure, and recovery should not be assigned to a single cause without evidence.
An honest assessment records what is visible and what remains uncertain, including whether enough time has passed to judge the particular outcome you wanted to observe.
What should you retain for next season?
At the end of the period, compare the records with the field map and identify where problems repeated. Preserve the chronology, including visits with no confirmed pest damage. That prevents an autumn suspicion from becoming a certain historical fact.
Use dedicated counts to assess plant population, and variety documents to choose seed. Monitoring, stand assessment and variety selection complement one another, but each needs its own evidence and a clearly stated question.
What questions arise in practice?
Does a low dry-weather catch mean low risk?
Repeat inspection when the surface is moist and activity can be observed. Keep the first sheet with its weather notes. A trap records activity under those conditions; interpret it alongside fresh plant injury and its field distribution rather than using the catch alone.
Can a BYDV map replace plant inspection?
A map helps schedule another visit. Plant inspection establishes vector presence, while diagnosis of virus disease is a separate task. The newer AHDB model includes more than temperature accumulation, and a British station does not represent weather in your Romanian field.
Can I combine hotspots with the rest of the field?
Keep hotspot and representative-route results separate. Use the former for diagnosis and targeted decisions, and the latter for the field overview. On return, inspect the same points and plant parts. Comparisons become useful when the method and measurement unit remain consistent.
What should I give the agronomist?
Send the sheet with wheat stage, trap locations, observation conditions, organisms found and fresh-damage photographs. Include field history and the question to resolve. This lets the agronomist connect a possible measure to confirmed risk and define what to check on the return visit.
How do you use the downloadable sheet?
Download the PDF booklet in this page’s language and use the article page identified in the link. Enter actual readings beside the references and retain the sheet with its sample or lot record. On the next visit compare the same units and record the change that supports the team’s decision.
- Mark the route, traps and hotspots on a sketch.
- Enter catches, injury and aphid presence separately.
- Set the return visit using weather, stage and observed changes.
Download the PDF checklist (1/9)
Which guides support the next check?
- Wheat stand density: counting plants and assessing gaps
- RECIPROC and SU TARROCA: comparing wheat varieties
- The potato year in Transylvania: a practical plan
Discuss field observations with the team
Sources and evidence
Documents checked on 20 October 2026; use the relevant sections in each source.