
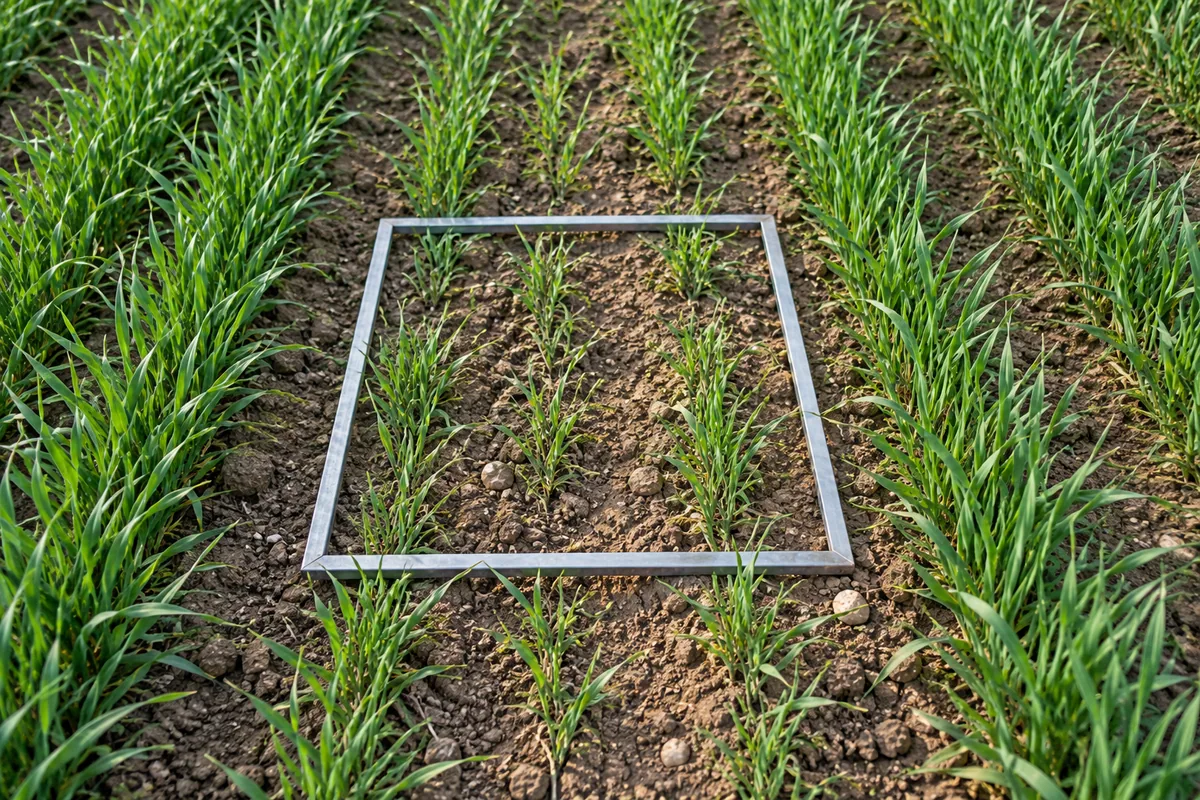
Wheat stand density: counting plants and assessing gaps
An article by the Agrico-M team. Agronomic information is general; technical sources are identified in the article where cited. Contact our team to suggest a correction. Contact
For commercial autumn wheat in Transylvania, count live plants within a known area and separate sparse zones before averaging. A measured frame and representative route produce results that can be compared on return. Use the conversions below after emergence and after winter, then assess crop retention with distribution, weeds and tillering potential in view.
Which practical reference points can you use?
Frame area determines the conversion factor; the route determines what the average represents. Enter plants and shoots in separate columns. AHDB sampling supports comparisons between visits. Its British population references help frame the discussion, while a Covasna field decision also needs gap distribution, weeds and root development to be assessed.
| Check and decision | Source / basis |
|---|---|
| Quadrat method: 0.5 × 0.5 m = 0.25 m²; measure the sides before use. | AHDB — Cereal plant counts |
| AHDB uses 10 representative areas; multiply the mean count in 0.25 m² quadrats by 4. | AHDB — Cereal plant counts |
| For row sampling use 30 cm length and actual row spacing; their product is the sampled area. | AHDB — Cereal plant counts |
| Worked example: 36 plants/0.25 m² gives 144 plants/m²; retain the raw count too. | Hypothetical example; editorial calculation or specification. |
| If those 36 plants carry 72 shoots, that is 2 shoots/plant and 288 shoots/m² under one counting convention. | Hypothetical example; editorial calculation or specification. |
| AHDB gives UK benchmarks of 70% establishment and 260 plants/m²; compare with your sowing and field conditions. | AHDB — Wheat establishment |
| About 150 plants/m² in the thinnest areas is an AHDB reference conditional on sowing date and weed pressure. | AHDB — Wheat establishment |
| If plants and tillers are hard to distinguish, lift the sample with roots and identify individual plants before averaging. | AHDB — Cereal plant counts |
Are you counting plants or shoots?
“How many plants emerged?”, “How many plants are still alive?” and “How many shoots does each plant carry?” are different questions. Individual plant counts describe establishment; shoot counts can also help describe the structure developing later.
Name the indicator at the top of the sheet. If one colleague counts plants and another counts stems, averaging their numbers does not create a consistent agronomic measurement. Agree on the counting convention first.
Where should you place sampling points?
Mark the route and measured points on a sketch. Decide how the frame will be placed before reaching each point, reducing the temptation to choose a good or poor spot unintentionally. Record any inaccessible area.
Keep counts from tramlines, wheel tracks and edges separate when they do not represent the area you want to describe. The limits of the sampling are part of the result, rather than details to remove from the final summary.
How do counts become plants/m²?
If those same plants carry 72 shoots under a consistent counting convention, that gives 288 shoots per square metre and two shoots per plant within the sample. State whether the main stem is included. Repeat at additional points and preserve the individual readings. AHDB — Cereal plant counts
This example does not predict how many shoots will form ears, estimate yield or establish whether the crop is satisfactory. It simply shows how different indicators relate without confusing them.
What can the field average conceal?
Two fields can share an average while having very different distributions. One may be sparse but fairly uniform; another may contain dense strips separated by bare areas. Report the average alongside the range of counts and a description of the zones.
If zones occupy very different areas, a simple average of their values is not automatically the whole-field average. Explain what your summary represents before using it to compare fields or seasons.
Repeated photographs from the same positions help show the size of gaps, but keep counts as a separate measurement. Leaves covering the soil do not mean new plants have appeared. Likewise, a small crop in late autumn cannot be compared directly with a field photographed at a later growth stage. Include date and observed stage with every comparison so that colleagues using the record later understand what changed and what was merely photographed differently.
How do you investigate the gaps?
AHDB’s establishment guide discusses several influences, including soil conditions, weather and biological problems. Use that as a set of questions, rather than a remote diagnosis. In weaker zones, examine what remains in the row, the condition of surviving plants and whether the pattern follows a soil change or sowing operation.
Compare with a nearby better-established area using the same observations. A plausible explanation still needs evidence from the actual field.
Where you can identify them, record ungerminated seeds, seedlings that did not reach the surface and plants lost after emergence separately. Do not assign every absence to the same cause if the evidence differs. Use the separate pest-monitoring guide for feeding signs and suspect organisms. A confirmed identification is more useful than a convenient label chosen because it matches the original article title. Keep uncertain findings available for the agronomist to assess.
How do you assess tillering compensation?
AHDB describes wheat’s ability to compensate for some establishment differences through plant development. That does not justify converting reduced density into a fixed yield-loss percentage or a promise of complete recovery. In the local assessment, follow surviving plants, new shoots and persistent gaps.
Discuss what is limiting development and what later observation might change the conclusion. Being explicit about uncertainty makes the eventual decision easier to review and explain.
Do not treat fertiliser as an automatic answer to a low count. Any proposed measure needs the field context, plant condition and nutritional assessment, rather than one number alone. Similarly, retaining, reassessing or replacing a crop requires consideration of actual costs and practical alternatives. This material provides neither a universal economic threshold nor an input prescription. Those decisions belong to a specific field assessment with the information available at that time.
What conclusion belongs on the sheet?
Write a short conclusion stating the area inspected, the indicator measured, how counts vary and which causes are confirmed or still uncertain. Add return points and the next assessment date. Preserve the original sheets, not just the final average.
A spring discussion can then use real development and consistent units, instead of relying on a memory of how thin the crop appeared during one visit. That record also shows what remains to be verified before action.
What questions arise in practice?
When should I repeat the count?
Compare an established-crop count with a post-winter count before rapid growth. Keep zones and units consistent. If new patches appear, add a separate diagnostic sample so that a change in sampling is not confused with a change across the whole crop.
Does a good average finish the assessment?
Check distribution too. A field with compact gaps can share the average of a thinner, uniform stand. Sketch the zones and retain the range of counts. Apply the average to the area it actually represents and describe separately any differences that would change the field decision.
Can density be converted directly into yield loss?
Track surviving plants, shoots and gap development first. Compensation depends on later growth and competition. A photograph or simple conversion of missing plants does not describe the future fertile ears. On return, record what changed in each measured indicator separately.
How do I compare counts made differently?
Compare sampled area, unit and whether the main stem was included. Recalculate only measurements with a consistent basis. If those details are missing, return together to a marked zone and make a shared count; this establishes a repeatable convention for later visits.
How do you use the downloadable sheet?
Download the PDF booklet in this page’s language and use the article page identified in the link. Enter actual readings beside the references and retain the sheet with its sample or lot record. On the next visit compare the same units and record the change that supports the team’s decision.
- Measure the quadrat or row length and enter the unit.
- Count plants and shoots separately in marked zones.
- Calculate zone means and retain raw values for the next visit.
Download the PDF checklist (2/9)
Which guides support the next check?
- Wheat pest monitoring: protecting early tiller growth
- RECIPROC and SU TARROCA: comparing wheat varieties
- The potato year in Transylvania: a practical plan
Discuss field observations with the team
Sources and evidence
Documents checked on 20 October 2026; use the relevant sections in each source.